The Hidden Cost of “Good Enough” Routing
Most delivery companies do not have a routing problem. They have a cost leak problem.
A dispatcher looks at a map, draws lines between twenty stops, and calls it a day. Drivers follow the plan. Packages arrive. Customers are happy. On the surface, everything works.
But underneath, the numbers tell a different story. A driver backtracks three miles because Stop 14 was scheduled before Stop 8. Another idles for eight minutes at a red light that could have been avoided with a left turn two blocks earlier. A third drives an extra four miles to reach a depot that was actually closer to the end of the route than the beginning.
None of these decisions looks expensive in isolation. Multiply them across fifty drivers, two hundred days a year, and suddenly you are burning tens of thousands of gallons of fuel that did not need to be burned. At $3.50 per gallon, that is real money. At $5.00, it is a margin killer.
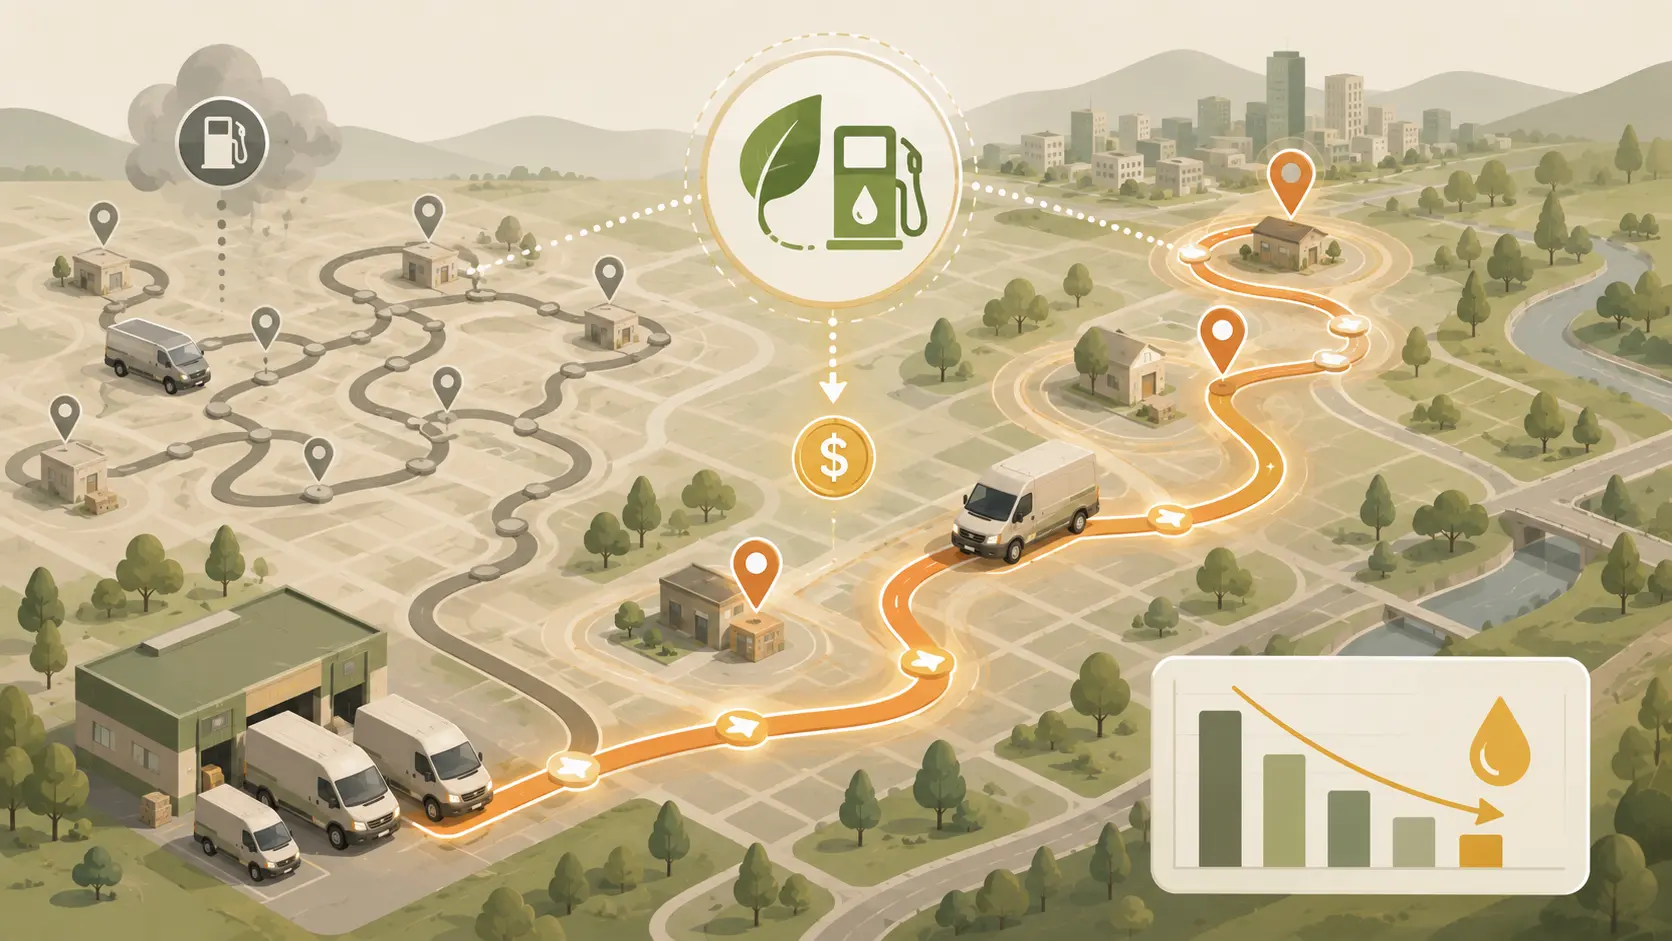
Route optimization is not about finding the shortest path. It is about finding the least wasteful path - the one that respects time windows, vehicle capacity, driver hours, traffic patterns, and fuel consumption simultaneously. When done right, it is one of the highest-ROI investments a delivery operation can make.
What Route Optimization Actually Does
At its core, route optimization solves a version of the Vehicle Routing Problem (VRP). The math is decades old. The implementation is what separates a spreadsheet from a competitive advantage.
A basic optimizer takes:
- A set of stops with delivery windows
- A fleet of vehicles with different capacities and fuel profiles
- Driver shift constraints
- Road network data with real-time traffic
- Fuel cost data and vehicle efficiency curves
And produces:
- The optimal assignment of stops to vehicles
- The optimal sequence of stops for each vehicle
- The optimal path between each pair of stops
- A predicted fuel consumption for the entire day
The key word is optimal. Not “pretty good.” Not “better than yesterday.” Optimal given the constraints you feed it.
This matters because delivery operations are full of hidden constraints that human dispatchers miss. A driver who knows the neighborhood might route around a school zone at 3:00 PM. But they will not simultaneously account for the weight distribution in their van, the fuel burn rate on a hill, the customer who only accepts deliveries after 2:00 PM, and the fact that the next closest stop is actually faster to reach via a counterintuitive back road.
Software does. At scale, that is the difference between a 12% fuel cost and an 18% fuel cost.
The Anatomy of a Fuel-Efficient Route
To understand where savings come from, it helps to look at what an unoptimized route actually wastes.
1. Backtracking and Crossover
The most visible waste is geographic. A driver visits Stop A, drives past Stop B to reach Stop C, then doubles back to B. The extra distance is pure inefficiency. In dense urban areas, a single crossover can add 10–15 minutes and half a gallon of fuel.
An optimizer eliminates this by sequencing stops to minimize total travel distance. In a twenty-stop route, the difference between a naive sequence and an optimized one is often 15–25% fewer miles driven.
2. Poor Load Sequencing
A van loaded with heavy packages at the front and light ones at the back handles differently. It burns more fuel accelerating, more fuel braking, and more fuel on hills. Worse, if the heavy stops are sequenced last, the driver is carrying dead weight for most of the route.
Advanced optimizers account for package weight and volume, sequencing heavy deliveries early and positioning them for efficient unloading. This reduces fuel consumption and driver fatigue simultaneously.
3. Ignoring Traffic Temporal Patterns
A route that looks efficient at 8:00 AM is a disaster at 4:30 PM. Traffic-aware optimization models historical and real-time traffic to schedule stops in the right order for the time of day. A stop near a school is scheduled at 10:00 AM, not 3:15 PM. A highway segment is used at 11:00 AM, not 5:00 PM.
The fuel savings here are indirect but significant. Idling in traffic burns fuel at 0.5–0.7 gallons per hour. A ten-minute delay costs half a gallon. Across a fleet, that is hundreds of gallons per week.
4. Inefficient Depot Positioning
Where a route starts and ends matters. A depot that is far from the delivery cluster forces empty miles at the beginning and end of every shift. Some companies solve this by using micro-fulfillment centers or dynamic start points. Others simply optimize the route to end near the depot, or to start from a secondary location.
An optimizer that knows the full day’s plan can recommend which depot to stage from, or whether a driver should return to a different depot for the afternoon shift. This is especially powerful for companies with multiple warehouses or cross-dock facilities.
5. Vehicle-Route Mismatch
Not every vehicle should run every route. A large van with a diesel engine is efficient on highway segments but wasteful on tight urban streets with frequent stops. A small electric van is perfect for dense urban clusters but cannot handle the rural outlier stops.
An optimizer assigns routes to vehicles based on fuel efficiency profiles, capacity, and suitability for the terrain. A rural route with long highway segments goes to the diesel van. A downtown cluster goes to the electric. The result is lower fuel cost per mile and lower total cost per delivery.
Real-World Impact: What the Numbers Look Like
Regional Courier, 120 Vehicles
A Midwest courier handling B2B deliveries across a 150-mile radius implemented route optimization for its entire fleet. Before optimization, drivers averaged 187 miles per day with an average fuel economy of 14.2 mpg. After optimization, miles per day dropped to 154 and fuel economy improved to 16.1 mpg.
The savings came from three sources:
- Reduced mileage: 33 fewer miles per day per vehicle = 3,960 fewer miles per day fleet-wide. At 15 mpg, that is 264 fewer gallons per day. At $3.80 per gallon, that is $1,003 per day, or $260,000 annually.
- Improved fuel economy: Better load sequencing and traffic avoidance added 1.9 mpg. On the remaining 154 miles, that saved an additional 1.3 gallons per vehicle per day, or $593 per day fleet-wide.
- Reduced overtime: Shorter routes meant drivers finished shifts on time. Overtime hours dropped 22%, saving an additional $180,000 in labor costs.
Total first-year savings: approximately $500,000. Implementation cost: $45,000. Payback period: five weeks.
Grocery Delivery, 40 Vehicles
A grocery chain offering same-day delivery from five stores faced a unique challenge: perishable goods. Delivery windows were tight (two-hour slots), and customer density varied wildly by neighborhood. Some routes had twelve stops within three miles. Others had four stops spread across twenty miles.
The company used route optimization with a custom constraint: maximize the number of stops per route while keeping total time under six hours (to preserve cold chain integrity). The optimizer also factored in vehicle type - refrigerated vans for frozen goods, insulated vans for produce.
Results after six months:
- Stops per route increased from 8.2 to 11.4, meaning fewer vehicles needed per day.
- Miles per stop dropped from 4.1 to 2.7, a 34% improvement in route density.
- Fuel cost per delivery fell 28%, from $1.90 to $1.37.
- Customer satisfaction scores improved because on-time delivery rose from 82% to 94%.
The grocery chain later expanded the program to all twelve stores, projecting annual fuel savings of $340,000.
Medical Supply Distribution, 25 Vehicles
A distributor of temperature-sensitive medical supplies operates under strict regulatory requirements. Deliveries must occur within specific windows, and some stops require signature verification or temperature logging. Vehicles are specialized - refrigerated units with backup power, GPS tracking, and tamper-evident seals.
The company implemented route optimization with a focus on predictability. Fuel savings were secondary to ensuring every route was executable within driver hours and regulatory constraints. The optimizer was configured to prefer routes with lower variability - even if the average distance was slightly longer, the worst-case scenario had to be feasible.
Results:
- Fuel cost per route dropped 12%, primarily from reduced backtracking.
- Failed deliveries (missed windows) fell from 6% to 0.8%, eliminating costly redelivery runs.
- Driver satisfaction improved because routes were more predictable and less stressful.
- Insurance premiums dropped because the company could demonstrate reduced risk through consistent, compliant routing.
The fuel savings were modest compared to the courier example, but the operational stability was worth significantly more. The company estimated that eliminating redelivery runs alone saved $120,000 annually - more than the fuel savings.
Why Automated Stop Ordering Matters
Many delivery companies think of route optimization as a map with lines. The real power is in the ordering - the sequence in which stops are visited.
Manual dispatchers order stops by neighborhood, by familiarity, or by gut feel. An optimizer orders them by mathematical efficiency. The difference is not subtle.
Consider a twenty-stop route in a suburban area. A human dispatcher might group stops by zip code: five in 90210, then five in 90211, then five in 90212. This feels logical. But zip codes are administrative boundaries, not geographic or traffic realities. The optimizer might find that three stops in 90210 are actually closer to four stops in 90211 than to the other two in 90210, and that visiting them in a zigzag pattern reduces total distance by 8%.
That zigzag looks wrong on paper. It is right on the road.
Automated ordering also adapts to real-time changes. A customer reschedules. A driver calls in sick. Traffic stalls on the planned highway. The optimizer resequences the remaining stops in seconds, preserving fuel efficiency while maintaining time windows. A human dispatcher takes twenty minutes to replan - and usually produces a worse result.
This is why multi-stop optimization with automated ordering is not a convenience feature. It is a cost control mechanism.
The Role of Multi-Stop Optimization
Single-route optimization is useful. Multi-stop optimization across an entire fleet is transformative.
When you optimize one route, you save fuel on that route. When you optimize all routes simultaneously, you save fuel and vehicles. The optimizer can balance loads across drivers, combine partial routes, and even suggest which routes to postpone or expedite based on fuel cost fluctuations.
For example:
- Morning vs. afternoon fueling: Diesel prices sometimes vary by time of day at certain stations. An optimizer can schedule routes to refuel at the cheapest time, even if it means a slight detour.
- Dynamic rerouting: If a driver is ahead of schedule, the optimizer can assign an additional stop from a slower driver, balancing the fleet and reducing total miles.
- Return-to-depot decisions: For long routes, the optimizer can calculate whether returning to the depot for a midday reload is more efficient than continuing with a partially loaded vehicle.
These decisions are invisible to the driver and the customer. They show up on the fuel bill.
What to Look for in a Route Optimization Platform
If you are evaluating optimization tools for your delivery operation, here are the capabilities that actually move the fuel needle.
1. Multi-Stop Optimization with Automated Ordering
The platform should handle complex routes with many stops and automatically determine the best sequence. Manual sequencing defeats the purpose. Look for systems that can optimize twenty, fifty, or even two hundred stops per route without human intervention.
2. Vehicle-Specific Fuel Modeling
Generic fuel estimates are useless. The platform should model fuel consumption based on vehicle type, load weight, terrain, and driving style. A heavy van climbing hills burns fuel differently than a light sedan on flat roads. The optimizer needs to know this.
3. Real-Time Traffic Integration
Historical traffic is a baseline. Real-time traffic is the difference between a plan and reality. The platform should adjust routes dynamically based on current conditions, not just yesterday’s averages.
4. Time Window and Constraint Handling
Delivery windows, driver shift limits, vehicle capacity, and special handling requirements (refrigeration, signature, HAZMAT) must be built into the optimization engine. A route that saves fuel but misses a delivery window is not optimized - it is broken.
5. Predictive Fuel Costing
The best platforms do not just minimize miles. They minimize cost. This means integrating fuel price data, toll costs, and vehicle wear-and-tear estimates into the optimization objective. Sometimes the longer route is cheaper because it avoids tolls or uses cheaper fuel stations.
6. Scalability
A platform that works for ten vehicles may choke at one hundred. Test the optimizer at your peak volume - holiday season, promotional events, or expansion plans. The math should not slow down when the business speeds up.
7. Offline Capability
For operations in areas with poor connectivity - rural routes, underground parking, remote warehouses - the optimizer should function offline. A cloud-only system leaves drivers stranded when the signal drops.
Common Pitfalls When Implementing Optimization
Even the best tool fails if the implementation is sloppy. Here is what goes wrong most often.
Bad Address Data
An optimizer is only as good as the coordinates it receives. “123 Main St” might resolve to a building centroid, a mailbox on the street, or a neighboring property. Geocode every stop precisely - ideally to the delivery entrance, not the street address. A fifty-foot error multiplied across two hundred stops is real distance.
Ignoring Driver Input
Drivers know the roads. They know which alleys are blocked, which loading docks are congested, which customers take forever to answer the door. An optimizer that ignores this intelligence produces plans that look perfect on a screen and fall apart on the street. Build feedback loops. Let drivers flag issues. Update the model continuously.
Over-Optimizing for One Metric
Fuel cost is important. But if you minimize fuel at the expense of driver satisfaction, customer satisfaction, or safety, you will lose more than you save. The best optimization balances multiple objectives with weighted priorities. Fuel might be 40% of the score, on-time delivery 30%, driver hours 20%, and customer preference 10%. The exact weights depend on your business.
Set-and-Forget
Road networks change. Customer density changes. Vehicle fleets change. An optimizer configured last year is not optimized for today. Review constraints, vehicle profiles, and objective weights quarterly. A/B test new parameters. Treat optimization as a living system, not a one-time project.
The Bottom Line
Route optimization is not a software category. It is a discipline. The companies that treat it seriously - investing in good data, smart constraints, and continuous refinement - run leaner fleets, happier drivers, and more profitable operations.
The fuel savings are the easiest metric to measure. A 15% reduction in fuel cost is common in the first year. A 25% reduction is achievable with advanced implementation. But the real value is in the operational stability: fewer missed windows, less overtime, lower turnover, and the ability to scale without proportionally scaling the fleet.
For delivery companies operating on thin margins, that is not just efficiency. It is survival.
Farun provides multi-stop route optimization with automated ordering, vehicle-specific fuel modeling, and offline capability for operations beyond reliable connectivity. If you are building or scaling a delivery fleet, explore the API or get in touch.
Published June 2026. Last updated June 2026.